How to use the Oura ring data in your life
Lately, you’ve probably been hearing a lot about the Oura ring, a fairly new wearable technology that’s out on the market.
This is a very robust option to monitor several parameters of your health, and so it can be confusing about how to interpret all the data collected from this amazing, stylish, high-tec tool.
(note: this post is not sponsored...I just LOVE the product)
In this blog post, you’ll learn how to understand the following data to biohack your recovery or to optimize performance:
Sleep Data
Heart Rate Variability (HRV)
Heart Rate (HR)
Body Temperature
Respiratory Rate
Sleep data
Every day when I wake up I check my Oura ring app for my sleep data. The app gives you a “readiness” score.
This number is 0-100 and the higher it is the more “ideal” a day is for challenging yourself or taking it easy.
The overall number for me doesn’t vary drastically so I dive into the specific data for clues as to how well rested my body is on a given day.
The Oura ring collects numerous sleep data contributors in addition to total sleep, time in bed, sleep efficiency, resting heart rate, and sleep stages.
The data I review daily includes
1. The quantity and quality of Sleep (Optimally sleep total is no less than 7.5 hours, with 1.5 hours of both deep and REM sleep each)
2. When looking at the sleep pattern for the night optimally there would be 1 wave of REM sleep within 90 minutes of falling asleep.
3. The first ½ of the night would account for the majority of deep sleep.
4. The second ½ of the night would have REM sleep predominate
5. There optimally are 2-3 sleep cycles present that follow the expected sleep pattern: light sleep→ deep sleep → light sleep→ REM sleep)
6. The sleep latency would be less than 30 minutes.
7.The frequency of waking at night would be 0-5% of the night.
8. The timing would be that the individual was asleep by 11pm at the latest to optimize the deep sleep (when the brain cleans itself, produces key hormones, and consolidates memories.)
Heart Rate Variability (HRV) data
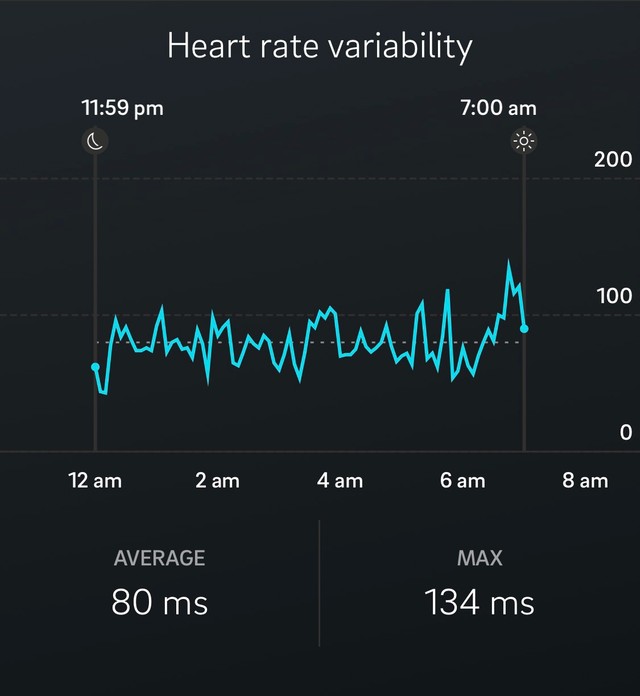
Heart rate variability is the exact change in time between heart beats.
A low HRV reflects the body leaning toward sympathetic nervous system activation (fight or flight).
A high HRV suggests a greater ability to tap into the parasympathetic nervous system (rest and digest).
It is helpful to note both what the average and peak HRV for the night as well as to look at the trend over the night to see if there was a blunting of the HRV at some point in the night. If HRV is lower at periods of the night you may correlate these times to when you were in light sleep.
Given the previous day’s physical or emotional stressors, HRV will fluctuate, should it dip steeply both the average and the peak value, it would be advisable to verify a degree of recovery from any excessive sympathetic NS stimulus (exercise or emotional/psychological stress) prior to challenging the body again with a hard training day for instance.
Interestingly enough, when an intense workout is just right for your body you may actually see an increase in average and peak HRV.
Similarly with fasting, when someone is keto adapted, you may also see an increase in HRV.
All stress is perceived by the body the same way.
The body is unable to appreciate chemically a difference between exercise stress, poor-sleep stress, work stress, illness stress, or fasting for too long stress.
These stressors will all be reflected in parameters measured by the Oura ring such as:
a decrease in heart rate variability
an exceptionally high or low heart rate
an increase in body temperature
a decrease in heart rate variability, an exceptionally high or low heart rate an increase in body temperature
a decrease in heart rate variability, an exceptionally high or low heart rate an increase in body temperature


